HappyCluster LogoHappyCluster

CHAP x DIFFERENTIAL

Based in Dubai, CHAP x DIFFERENTIAL develops commercial towers, retail destinations, and mixed-use gateways defined by asymmetrical faceted geometries, continuous corner-wrapping fins, and intricate light-modulating screens. This body of work serves as a precise reference when resolving thin double-curved cantilevered canopies, specifying illuminated ceiling installations across elevated spans, or balancing geometric solar shading in high-density developments.

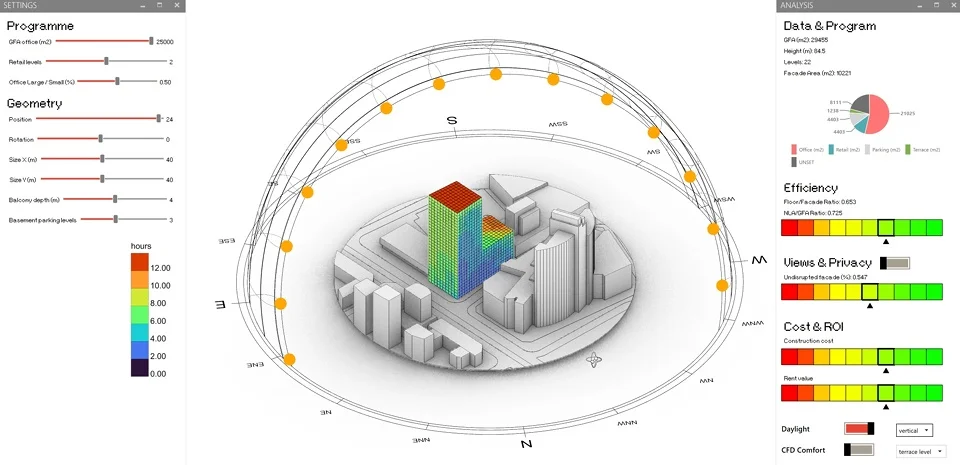
Interactive parametric daylight analysis dashboard showing a color-coded tower model beneath a solar dome by CHAP x DIFFERENTIAL.

CHAP-x-DIFFERENTIAL_Image-11_Daylight-Analysis

迪拜|Dubai

An interactive daylight and parametric performance dashboard linking program sliders and geometry adjustments to real-time solar heat-mapping for urban tower design.

What we like about this project
Comprehensive real-time feedback loops evaluating cost, efficiency, views, and solar exposure simultaneously.

Materials

  • digital-interface
  • wireframe
  • color-gradient

Visual identifiers

  • parametric-dashboard
  • solar-dome
  • daylight-heatmap
  • massing-model

Style tags

  • parametric
  • analytical
  • computational
  • diagrammatic

Visual tags

  • parametric-design
  • environmental-analysis
  • daylight-simulation
  • workflow-diagram
  • computational-design
Geometry
Isometric massing model centered within a wireframe solar dome and directional compass; analytical dashboard panels flank the left and right sides with sliders and metric gauges.
Spatial scale
Urban block scale with a 22-story tower centered in a district context.
Lighting
Simulated solar path indicated by an arc of numbered orange nodes overhead; gradient heat map on the tower model scales from purple (low hours) to red (high hours).
Atmosphere
Technical, data-driven, and precise.
Environmental context
Surrounding urban context massing rendered in neutral gray wireframe; explicit compass alignment and sun-path hemisphere.
Spatial experience
Gives an analytical, bird's-eye vantage over massing performance, translating geometric sliders into immediate environmental feedback across the form.
Composition rhythm
Tri-panel layout with central isometric model flanked by settings controls and quantitative evaluation metrics.
Style reading
Computational parametric analysis interface
Program
Commercial office tower with retail podium
Perspective
Drawing / Diagram
Discipline
architecture
Materials
digital-interface, wireframe, color-gradient
Visual identifiers
parametric-dashboard, solar-dome, daylight-heatmap, massing-model
Style tags
parametric, analytical, computational, diagrammatic
Visual tags
parametric-design, environmental-analysis, daylight-simulation, workflow-diagram, computational-design
Geometry
Isometric massing model centered within a wireframe solar dome and directional compass; analytical dashboard panels flank the left and right sides with sliders and metric gauges.
Spatial scale
Urban block scale with a 22-story tower centered in a district context.
Lighting
Simulated solar path indicated by an arc of numbered orange nodes overhead; gradient heat map on the tower model scales from purple (low hours) to red (high hours).
Atmosphere
Technical, data-driven, and precise.
Environmental context
Surrounding urban context massing rendered in neutral gray wireframe; explicit compass alignment and sun-path hemisphere.
Spatial experience
Gives an analytical, bird's-eye vantage over massing performance, translating geometric sliders into immediate environmental feedback across the form.
Composition rhythm
Tri-panel layout with central isometric model flanked by settings controls and quantitative evaluation metrics.
Style reading
Computational parametric analysis interface
Program
Commercial office tower with retail podium
Perspective
Drawing / Diagram
Discipline
architecture

Related in this portfolio

Directories

  • Firms
  • Patterns

AI Native Apps

  • AI Mode Search
  • SoftMarket
  • 2nd Brain

About HappyCluster

  • About
  • How it works
  • Contact

Connect

  • Waitlist
  • X
  • GitHub

Legal

  • Privacy
  • Terms
  • © 2026 HappyCluster

Directories

  • Firms
  • Patterns

AI Native Apps

  • AI Mode Search
  • SoftMarket
  • 2nd Brain

About HappyCluster

  • About
  • How it works
  • Contact

Connect

  • Waitlist
  • X
  • GitHub

Legal

  • Privacy
  • Terms

HappyCluster

© 2026

Interactive parametric daylight analysis dashboard showing a color-coded tower model beneath a solar dome by CHAP x DIFFERENTIAL.

CHAP-x-DIFFERENTIAL_Image-11_Daylight-Analysis

迪拜|Dubai

An interactive daylight and parametric performance dashboard linking program sliders and geometry adjustments to real-time solar heat-mapping for urban tower design.

What we like about this project
Comprehensive real-time feedback loops evaluating cost, efficiency, views, and solar exposure simultaneously.

Materials

  • digital-interface
  • wireframe
  • color-gradient

Visual identifiers

  • parametric-dashboard
  • solar-dome
  • daylight-heatmap
  • massing-model

Style tags

  • parametric
  • analytical
  • computational
  • diagrammatic

Visual tags

  • parametric-design
  • environmental-analysis
  • daylight-simulation
  • workflow-diagram
  • computational-design
Geometry
Isometric massing model centered within a wireframe solar dome and directional compass; analytical dashboard panels flank the left and right sides with sliders and metric gauges.
Spatial scale
Urban block scale with a 22-story tower centered in a district context.
Lighting
Simulated solar path indicated by an arc of numbered orange nodes overhead; gradient heat map on the tower model scales from purple (low hours) to red (high hours).
Atmosphere
Technical, data-driven, and precise.
Environmental context
Surrounding urban context massing rendered in neutral gray wireframe; explicit compass alignment and sun-path hemisphere.
Spatial experience
Gives an analytical, bird's-eye vantage over massing performance, translating geometric sliders into immediate environmental feedback across the form.
Composition rhythm
Tri-panel layout with central isometric model flanked by settings controls and quantitative evaluation metrics.
Style reading
Computational parametric analysis interface
Program
Commercial office tower with retail podium
Perspective
Drawing / Diagram
Discipline
architecture
Materials
digital-interface, wireframe, color-gradient
Visual identifiers
parametric-dashboard, solar-dome, daylight-heatmap, massing-model
Style tags
parametric, analytical, computational, diagrammatic
Visual tags
parametric-design, environmental-analysis, daylight-simulation, workflow-diagram, computational-design
Geometry
Isometric massing model centered within a wireframe solar dome and directional compass; analytical dashboard panels flank the left and right sides with sliders and metric gauges.
Spatial scale
Urban block scale with a 22-story tower centered in a district context.
Lighting
Simulated solar path indicated by an arc of numbered orange nodes overhead; gradient heat map on the tower model scales from purple (low hours) to red (high hours).
Atmosphere
Technical, data-driven, and precise.
Environmental context
Surrounding urban context massing rendered in neutral gray wireframe; explicit compass alignment and sun-path hemisphere.
Spatial experience
Gives an analytical, bird's-eye vantage over massing performance, translating geometric sliders into immediate environmental feedback across the form.
Composition rhythm
Tri-panel layout with central isometric model flanked by settings controls and quantitative evaluation metrics.
Style reading
Computational parametric analysis interface
Program
Commercial office tower with retail podium
Perspective
Drawing / Diagram
Discipline
architecture

Related in this portfolio